 Web Server Statistics for alegegroup.com
Program started on Fri, Dec 30 2016 at 2:18 PM.
Analyzed requests from Fri, Nov 18 2016 at 7:13 PM to Fri, Dec 30 2016 at 11:04 AM (41.66 days).
Web Server Statistics for alegegroup.comProgram started on Fri, Dec 30 2016 at 2:18 PM.
Analyzed requests from Fri, Nov 18 2016 at 7:13 PM to Fri, Dec 30 2016 at 11:04 AM (41.66 days).
(Go To: Top | General Summary | Monthly Report | Daily Summary | Hourly Summary | Domain Report | Organization Report | Referring Site Report | Browser Report | Browser Summary | Operating System Report | Status Code Report | File Size Report | File Type Report | Directory Report | Request Report)
Figures in parentheses refer to the 7-day period ending Dec 30 2016 at 2:18 PM.
Successful requests: 34 (14)
Successful requests for pages: 21 (1)
Failed requests: 8 (0)
Distinct files requested: 12 (8)
Distinct hosts served: 29 (10)
Data transferred: 519.67 kilobytes (190.25 kilobytes)
Average data transferred per day: 12.47 kilobytes (27.18 kilobytes)
(Go To: Top | General Summary | Monthly Report | Daily Summary | Hourly Summary | Domain Report | Organization Report | Referring Site Report | Browser Report | Browser Summary | Operating System Report | Status Code Report | File Size Report | File Type Report | Directory Report | Request Report)
Each unit ( ) represents 1 request for a page.
| month | #reqs | #pages | |
|---|---|---|---|
| Nov 2016 | 9 | 9 |  |
| Dec 2016 | 25 | 12 |  |
Busiest month: Dec 2016 (12 requests for pages).
(Go To: Top | General Summary | Monthly Report | Daily Summary | Hourly Summary | Domain Report | Organization Report | Referring Site Report | Browser Report | Browser Summary | Operating System Report | Status Code Report | File Size Report | File Type Report | Directory Report | Request Report)
Each unit () represents 1 request for a page.
| day | #reqs | #pages | |
|---|---|---|---|
| Sun | 5 | 5 | |
| Mon | 3 | 3 |  |
| Tue | 2 | 2 | |
| Wed | 0 | 0 | |
| Thu | 0 | 0 | |
| Fri | 20 | 7 | |
| Sat | 4 | 4 | |
(Go To: Top | General Summary | Monthly Report | Daily Summary | Hourly Summary | Domain Report | Organization Report | Referring Site Report | Browser Report | Browser Summary | Operating System Report | Status Code Report | File Size Report | File Type Report | Directory Report | Request Report)
Each unit () represents 1 request for a page.
| hour | #reqs | #pages | |
|---|---|---|---|
| 0 | 0 | 0 | |
| 1 | 2 | 2 | |
| 2 | 0 | 0 | |
| 3 | 0 | 0 | |
| 4 | 2 | 2 | |
| 5 | 1 | 1 | |
| 6 | 2 | 2 | |
| 7 | 0 | 0 | |
| 8 | 0 | 0 | |
| 9 | 0 | 0 | |
| 10 | 0 | 0 | |
| 11 | 14 | 1 | |
| 12 | 2 | 2 | |
| 13 | 1 | 1 | |
| 14 | 0 | 0 | |
| 15 | 0 | 0 | |
| 16 | 0 | 0 | |
| 17 | 0 | 0 | |
| 18 | 2 | 2 | |
| 19 | 6 | 6 | |
| 20 | 1 | 1 | |
| 21 | 0 | 0 | |
| 22 | 1 | 1 | |
| 23 | 0 | 0 |
(Go To: Top | General Summary | Monthly Report | Daily Summary | Hourly Summary | Domain Report | Organization Report | Referring Site Report | Browser Report | Browser Summary | Operating System Report | Status Code Report | File Size Report | File Type Report | Directory Report | Request Report)
Listing domains, sorted by the amount of traffic.
| #reqs | %bytes | domain |
|---|---|---|
| 34 | 100% | [unresolved numerical addresses] |
(Go To: Top | General Summary | Monthly Report | Daily Summary | Hourly Summary | Domain Report | Organization Report | Referring Site Report | Browser Report | Browser Summary | Operating System Report | Status Code Report | File Size Report | File Type Report | Directory Report | Request Report)
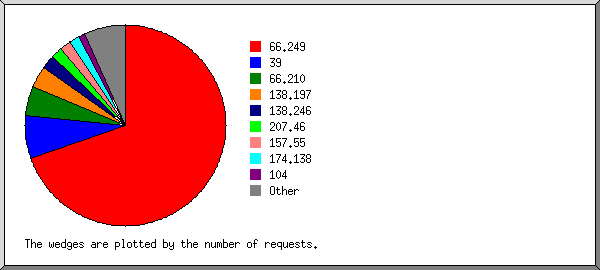
Listing organizations, sorted by the number of requests.
| #reqs | %bytes | organization |
|---|---|---|
| 14 | 44.38% | 138.197 |
| 7 | 23.81% | 173.252 |
| 7 | 12.80% | 31 |
| 3 | 9.50% | 104 |
| 2 | 6.35% | 159.203 |
| 1 | 3.16% | 45 |
(Go To: Top | General Summary | Monthly Report | Daily Summary | Hourly Summary | Domain Report | Organization Report | Referring Site Report | Browser Report | Browser Summary | Operating System Report | Status Code Report | File Size Report | File Type Report | Directory Report | Request Report)
Listing referring sites, sorted by the number of requests.
| #reqs | site |
|---|---|
| 6 | https://www.alegegroup.com/ |
(Go To: Top | General Summary | Monthly Report | Daily Summary | Hourly Summary | Domain Report | Organization Report | Referring Site Report | Browser Report | Browser Summary | Operating System Report | Status Code Report | File Size Report | File Type Report | Directory Report | Request Report)
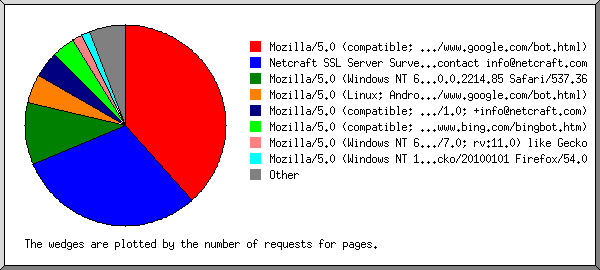
Listing browsers with at least 1 request for a page, sorted by the number of requests for pages.
| #reqs | #pages | browser |
|---|---|---|
| 20 | 20 | Netcraft SSL Server Survey - contact info@netcraft.com |
| 14 | 1 | facebookexternalhit/1.1 (+http://www.facebook.com/externalhit_uatext.php) |
(Go To: Top | General Summary | Monthly Report | Daily Summary | Hourly Summary | Domain Report | Organization Report | Referring Site Report | Browser Report | Browser Summary | Operating System Report | Status Code Report | File Size Report | File Type Report | Directory Report | Request Report)
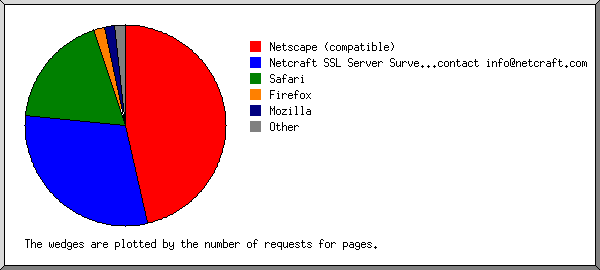
Listing browsers with at least 1 request for a page, sorted by the number of requests for pages.
| # | #reqs | #pages | browser |
|---|---|---|---|
| 1 | 20 | 20 | Netcraft SSL Server Survey - contact info@netcraft.com |
| 2 | 14 | 1 | facebookexternalhit |
| 14 | 1 | facebookexternalhit/1 |
(Go To: Top | General Summary | Monthly Report | Daily Summary | Hourly Summary | Domain Report | Organization Report | Referring Site Report | Browser Report | Browser Summary | Operating System Report | Status Code Report | File Size Report | File Type Report | Directory Report | Request Report)
Listing operating systems, sorted by the number of requests for pages.
| # | #reqs | #pages | OS |
|---|---|---|---|
| 1 | 34 | 21 | OS unknown |
(Go To: Top | General Summary | Monthly Report | Daily Summary | Hourly Summary | Domain Report | Organization Report | Referring Site Report | Browser Report | Browser Summary | Operating System Report | Status Code Report | File Size Report | File Type Report | Directory Report | Request Report)
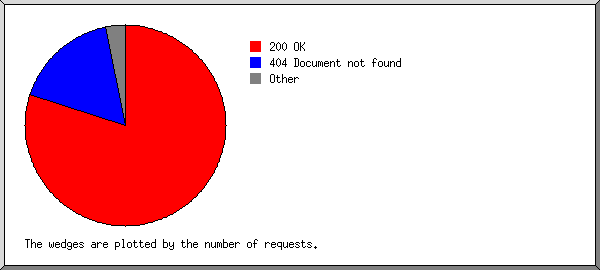
Listing status codes, sorted numerically.
| #reqs | status code |
|---|---|
| 27 | 200 OK |
| 7 | 206 Partial content |
| 8 | 404 Document not found |
(Go To: Top | General Summary | Monthly Report | Daily Summary | Hourly Summary | Domain Report | Organization Report | Referring Site Report | Browser Report | Browser Summary | Operating System Report | Status Code Report | File Size Report | File Type Report | Directory Report | Request Report)
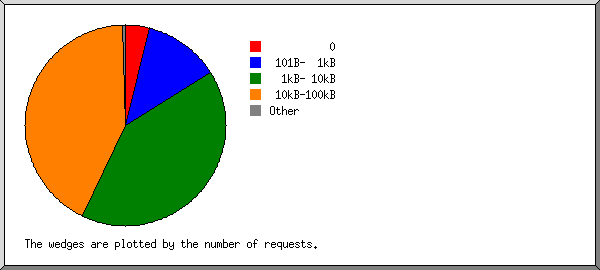
| size | #reqs | %bytes |
|---|---|---|
| 0 | 0 | |
| 1B- 10B | 0 | |
| 11B- 100B | 0 | |
| 101B- 1kB | 0 | |
| 1kB- 10kB | 9 | 14.80% |
| 10kB-100kB | 25 | 85.20% |
(Go To: Top | General Summary | Monthly Report | Daily Summary | Hourly Summary | Domain Report | Organization Report | Referring Site Report | Browser Report | Browser Summary | Operating System Report | Status Code Report | File Size Report | File Type Report | Directory Report | Request Report)
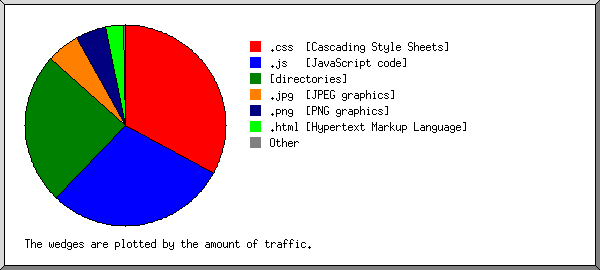
Listing extensions with at least 0.1% of the traffic, sorted by the amount of traffic.
| #reqs | %bytes | extension |
|---|---|---|
| 21 | 66.30% | [directories] |
| 9 | 18.60% | .jpg [JPEG graphics] |
| 4 | 15.10% | .png [PNG graphics] |
(Go To: Top | General Summary | Monthly Report | Daily Summary | Hourly Summary | Domain Report | Organization Report | Referring Site Report | Browser Report | Browser Summary | Operating System Report | Status Code Report | File Size Report | File Type Report | Directory Report | Request Report)
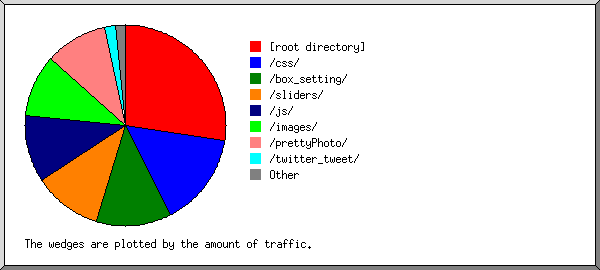
Listing directories with at least 0.01% of the traffic, sorted by the amount of traffic.
| #reqs | %bytes | directory |
|---|---|---|
| 21 | 66.30% | [root directory] |
| 13 | 33.70% | /images/ |
(Go To: Top | General Summary | Monthly Report | Daily Summary | Hourly Summary | Domain Report | Organization Report | Referring Site Report | Browser Report | Browser Summary | Operating System Report | Status Code Report | File Size Report | File Type Report | Directory Report | Request Report)
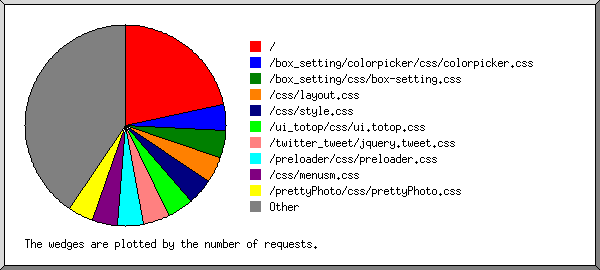
Listing files with at least 20 requests, sorted by the number of requests.
| #reqs | %bytes | last time | file |
|---|---|---|---|
| 21 | 66.30% | Dec/30/16 11:04 AM | / |
| 13 | 33.70% | Dec/30/16 11:04 AM | [not listed: 7 files] |